Bass Diffusion Analysis for OLED display phones
From DolceraWiki
Revision as of 15:18, 18 June 2009 by Ankitbiyani (Talk | contribs)
Contents
Bass Diffusion Model Terminology
Some of the terms used in the model are:
Three key parameters used in the Bass Diffusion Model are:
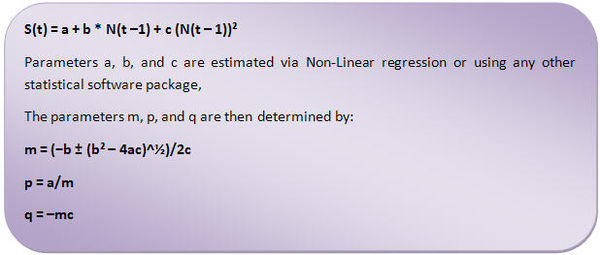
Some of the formulas used are:
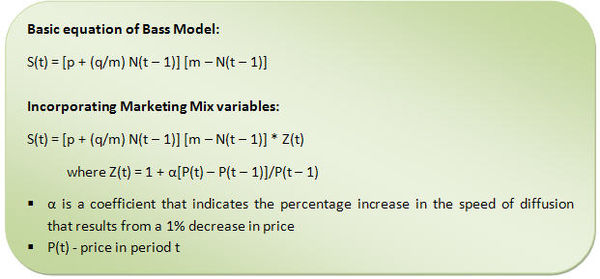
Bass Model Equations:
Adoption curve for new product are generally called S-curves because of their shape.
OLED Mobile Phone projections based on Analogous Products
Estimation of Parameters
- LCD TV
- The historical sales data from 2002 to 2008 was obtained from secondary sources
- The cumulative sales till last year for each year, N(t-1) was calculated
- Non-linear regressionwas run to determine a, b and c
- m, p and q values were calculated from the values of a, b and c by putting them in the aforementioned formulae
The same procedure was followed for Plasma Display TVs and LCD Monitors.
Procedure for forecasting
- 1. Weighted p and q were calculated based on the analogous products such as LCD TVs, Plasma Display TVs and LCD monitors.
- i. To judge the similarity of analogous products to OLED, the following two criteria were examined:
- a. Market Structure
- b. Product Characteristics
- a. Market Structure
- ii. Depending on the importance of the criteria, weights were assigned: 0.4 for Market Structure and 0.6 for Product Characteristics
- iii. Based on the similarity of the analogous products numerical weights were assigned to them on a scale of 1 to 10 for each criterion.
- iv. Weighted average for p and q were calculated based on the p and q values of analogous products and the corresponding weights assigned to them <<excel sheet with calculations>>
- i. To judge the similarity of analogous products to OLED, the following two criteria were examined:
- 2. Market potential of OLED phones was taken as the m value of smart-phones segment, which is 884.07 million <<excel sheet with calculations>>
- 3. Then forecasted the adoption rate of OLED display phones using the basic equation of the Bass Model <<excel sheet with calculations>>
Comparison of Adoption rate of Innovators with those of Imitators
- Sales to innovators and imitators for each year was determied based on the values of p, q and m
- m for each year was taken as m-N(t-1) - it represents the number of consumers who have not previously adopted by the start of time t, this is the pool from which the new adoptions in the current period can occur <<excel sheet with calculations>>
OLED Mobile Phone Projections Based on I-Phone
- p, q and m values are calculated for I-Phone from historical data
- Forecaste of the cumulative sales or adoption rate of OLED display mobile phones was done based on the p, q and m values <<excel sheet with calculations>>
Comparison of Adoption rate of Innovators with those of Imitators
- Sales to innovators and imitators for each year was determied based on the values of p, q and m
- m for each year was taken as m-N(t-1) - it represents the number of consumers who have not previously adopted by the start of time t, this is the pool from which the new adoptions in the current period can occur <<excel sheet with calculations>>


